

This page is part of the Pulse guide. Start there for what the extension does, installation and the frequently asked questions.
Interactive revenue chart
- What it does: A live chart of one metric over time: Revenue, Profit (with ProfitEasy), Orders, Visitors, or Conversion. Pick the metric from the chart selector and an optional comparison from the chart options, either the previous period or the same period last year. The chart title shows a short summary of the metric, its value, and the change against the comparison (for example "Revenue: $759 ↓ 20% vs previous 7 days"); untick Show summary in title in the chart options to hide it. Click a point to drill into the orders behind it; zoom drag to focus a window; hover for formatted tooltips in the store's currency and timezone. The chart opens as an area chart. Its options also include a chart-only Period and "Show data by" setting (Auto, Daily or Monthly). These follow the dashboard period unless you change them, and you can chart up to two years. The last point of a range that includes today is drawn dashed because that day or hour is still filling in. If a comparison value has not been calculated yet, the tooltip shows "Calculating" instead of $0.
- When to use it: Any time you want to explain a spike or dip without running a report. Pair with Events to annotate campaigns, deploys, and incidents directly on the timeline.
- Chart types and the automatic hourly/daily grouping are not shown in the admin; support can change them with
moogento:pulse:config:set(pathschart/enabled_chart_typesandchart/timescale).
Live ticker and health state
- What it does: A thin strip at the top of the dashboard showing 24-hour revenue, orders, visitors, and conversion, an adaptive health state (Normal / Slowing / Risk). The "no recent orders" threshold scales with your historical hourly order rate - busy stores get alerted after minutes, quiet stores after hours.
- When to use it: Always on. It's the fastest way to know something is up.
Pulse Insights card (Pro)
- What it does: On a Pro plan, the Last Order tile in the top row is replaced by a Pulse Insights card. It shows one finding at a time about what changed in your store, whether that is good or bad, and where to look. Each finding quotes numbers from your own orders, refunds and profit data.
- Where to find it: The top row of the dashboard, in the live ticker strip. The page buttons sit beside the card title. Use the previous and next arrows to read the other findings, or press the Left and Right arrow keys while the card has focus.
- Details: Each finding shows a short headline and a one-line summary. A caret button appears when you hover over the card or focus it, and on touch screens it is always visible. Press it to show the comparison behind the finding, such as "Orders went from 180 → 212 (previous 28 days → last 28 days)". Press it again to hide the comparison.
- Last order: The card footer shows how long ago the last order was placed ("Last order 12 min ago", or "No orders yet"), and a link to view orders or refunds when a finding points there.
- Who sees profit findings: Profit and margin findings show only to admins who can see the Profit KPI tile, under Dashboard section ACL.
- Refresh: The card updates when the dashboard refreshes. A new order can take up to 5 minutes by default to clear a "Orders unusually quiet" finding, because the dashboard refresh runs on a schedule.
- Other plans: Seed, Growth, and unlicensed installs keep the Last Order tile.
- Hiding it: Remove the card with the dashboard tile chooser, as you would any other tile.
Priority labels:
- Needs attention: something has dropped or stopped and is worth checking today, such as orders being unusually quiet, sales falling, profit falling, or refunds running high.
- Worth a look: a finding that points to an opportunity rather than a problem.
- Good news: a clear improvement, such as revenue or profit rising.
- Paused: Pulse's order summaries are catching up. It is shown as a status note ranked after the other findings, so it does not hide them. If it lasts more than an hour, check that Magento cron is running.
When there is nothing to report, the card says so. "Everything looks normal" means sales and order pace are within their usual range. "Gathering insights" means Pulse needs more order history or order volume before it can compare.
What the card compares over 28 days
Alongside the sales, order pace and refund findings, the card compares your last 28 complete days with the 28 days before them. These findings use your order data and read in plain language, with the numbers behind them:
- Products: a product whose sales rose or fell sharply, and when a small set of top products makes up an unusually large share of product sales.
- Categories: a category whose sales are growing or slowing.
- Payment and shipping methods: a payment or shipping method that took a noticeably bigger or smaller share of orders.
- Returning customers: a clear shift in the share of revenue that comes from returning customers. Only orders with a customer email are counted, and the card shows totals only, never customer names.
- AI assistants: a clear rise or fall in recorded visits from AI assistants.
The card stays quiet about these families unless the numbers are big enough to mean something. A finding needs enough orders in both periods, a change large enough to matter, and an effect large enough to matter in money or orders. It also stays quiet when:
- stores in the selected scope use different time zones, or money amounts cannot be converted to one currency (order-count shares such as payment methods still show),
- the store has fewer than 60 orders in either 28-day period (this applies to all of these findings),
- the customer finding has too little identified-customer data.
These findings do not depend on the dashboard date range. A quiet card is normal for a steady store.
Visitor tracking
- What it does: A one-line status strip at the bottom of the dashboard that tells you whether session tracking is switched on and its 15-minute check is running for the selected scope. Most days it has nothing to say, so it stays to a single row: a state icon, "Visitor tracking: ", how long ago the last check ran, and a Check setup button.
- States: Tracking active (green), Collecting history (neutral), Needs attention (amber), Tracking off (grey), Status unavailable (grey). Needs attention adds a second line explaining the problem and gives the Check setup button more emphasis.
- Tooltip: Hover or focus the state text to see when tracking has been running without a break, whether the selected date range is fully covered, when the 7-day and 30-day comparisons unlock, the share of visits from unknown customers, and the consent note. Press Escape to close a tooltip.
- Check setup: The button checks each store in the scope and reports a one-line summary (collectors off, missing heartbeats, recorded error codes). The raw response is available under a details toggle for support requests. It is read-only and changes nothing.
- When to use it: Whenever the Conversion KPI is blank or a comparison looks wrong. The strip explains why instead of guessing.
KPI hero tiles
- What it does: Units Sold, AOV, Refunds, Discounts, Visitors, Conversion, Repeat customers, and (with ProfitEasy) Profit and CLV, each with a delta versus the previous period or the same period a year ago. Revenue and Orders sit in the ticker. Refunds, Discounts, and Repeat customers are off by default; turn them on from the dashboard settings.
- Margin card: Shows your catalogue's average product margin as a percent by default. Hover the card and click the gear button to switch it to a money value instead - your choice is remembered on that browser. If ProfitEasy's margin data hasn't refreshed in a while, the card keeps showing the last known figure with a small clock icon and a note like "Updated 3 days ago", rather than going blank; hover the note for why (usually Magento cron not running, or a very large catalogue still refreshing). It only shows a dash when there's no margin figure at all, with a short reason such as "No product costs" or "Needs ProfitEasy".
- Conversion card: The share of visits in the selected range that placed at least one order, using Pulse's own visitor tracking (or Google Analytics when Pulse tracking doesn't cover the range and GA4 is connected). Hover the card to see the source. It stays a dash until there's enough tracking history to trust the number - see Visitor tracking below.
- When to use it: Every period review. The year-ago comparison is especially useful for seasonal stores.
Orders-by-hour heatmap
- What it does: A grid of day-of-week by hour-of-day coloured by order volume, with summary tiles for peak window, busiest day, and quiet hours.
- When to use it: Plan staffing for support and fulfilment, time promotional emails, or schedule deployments in your quietest window.
Recent order stream
- What it does: A live table of your 20 most recent orders from the last 24 hours with customer, value, payment method, and optional AOV / CLV / VIP / refund badges. Click any increment ID to open the order. When ProfitEasy is installed, a Sources column shows up to three source icons per order, or "Unknown" when the order has no qualifying touch; hide it from the column chooser if you do not need it.
- When to use it: Spot-check new orders, catch payment-method anomalies, and prioritise VIP customer experience.
Sources card
- What it does: Shows where the period's revenue and assisted orders came from, one row per source. Each row leads with its share of the total as a whole percentage, and the rows always add up to 100%. The money amount sits beneath it. The gear menu sets the rank-by metric and the Show amounts toggles for Allocated and Assisted. Click a row to open its detail below the chart. Orders helped ranks by order count and shows no percentage. On Last 12 Months and Last 24 Months, the card reads stored order history; while that history is still being prepared it shows a preparation message. If some orders cannot be valued, the report is marked Partial and shows how many orders were left out and why.
- Availability: Shown beside the revenue chart for Growth and Pro plans with chart and campaign access.
- When to use it: Deciding which channels deserve budget, or checking how much of a sale a touchpoint actually assisted.
Alert center
- What it does: A dedicated Suggestions & Alerts block with tabs for open suggestions, active alerts, and Events. The alert list scrolls inside its card, so a long list never pushes the rest of the dashboard down. Each alert has a severity (info / warning / critical), a status (new / acknowledged / resolved), and an Investigate action that jumps to filtered orders.
- When to use it: Quick-triage each morning, or whenever the ticker's health state changes. Acknowledge alerts to move them out of the new lane without losing history.
- Revenue Drop: compares the store's sales so far today with the same hours on the four previous same weekdays. It needs enough recent orders and comparable weeks, and it alerts only when the drop holds across two checks in a row.
- Config path:
moogento_pulse/alerts/*
Annotations and event timeline
- What it does: Tag moments on your revenue chart - Campaign (teal), Promotion (amber), Deploy (blue), Note (grey), Incident (red), Holiday (purple). Manual entries take precedence; optional automatic UTM detection creates annotations for campaigns seen in recent orders. Events are listed in the Events tab beside Suggestions and Alerts, where you add, edit, and delete them.
- When to use it: Every time you ship a change, run a promotion, or experience an outage. Future-you reviewing a chart will want to know what that spike or dip was.
- Config path:
moogento_pulse/annotations/utm_detection_enable(auto-detection; needs ProfitEasy)
Top Products and Top Customers
- What it does: Two half-width ranked lists. Top Products shows items ranked by period revenue. Top Customers shows each customer's CLV as the headline value when ProfitEasy is installed (falls back to period revenue), plus AOV, region and country flag, a clickable last-order button showing the grand total, and the coupon code used on that order when one was applied. Both lists let you choose the number of rows (1-10) from the section gear menu.
- When to use it: Top Products during merchandising reviews to see what's actually selling. Top Customers during loyalty and VIP planning - the CLV headline tells you the long-term value of each buyer at a glance.
Category Rankings
- What it does: A half-width tabbed section with two views. Top Categories ranks categories that appear in your storefront navigation. Top Collections ranks your merchandised groups. Pulse finds them automatically: categories like New Arrivals, Best Sellers or Featured, categories under Specials, Sale or Brands, and categories hidden from the menu. To choose them yourself, pick parent categories in the Collections: Parent Categories setting. Both tabs share a column chooser and persist the active tab per user in the browser. Each tab shows the top 5 rows; Show N more reveals up to 10, and Show fewer collapses the list again.
- When to use it: Compare storefront categories against curated collection pages. Spot which hidden collection pages are driving disproportionate revenue.
Category Insights
- What it does: A half-width tabbed card combining Category Share (how each category's revenue contribution compares across the period) and Category Momentum (which categories are growing or declining relative to the prior period). Every category displays its store-specific name, current and comparison revenue, and share percentage. Legends show currency next to every percentage, e.g. $4,800, 60%. Next to each category, in both the rankings and the legends, a chevron button opens a drilldown by mouse click or keyboard (Enter or Space), loading the category's top products in place with thumbnail, SKU, name (linked to edit the product), revenue, and revenue share.
- When to use it: Weekly merchandising reviews. Momentum is the earliest indicator of a category going out of fashion or surging due to a campaign. Use the drilldown to quickly see which specific products in a growing category are driving the momentum.
Opportunity Insights
- What it does: A half-width tabbed card combining Opportunity Mix (categories classified as growing, stable, or declining) and Revenue Mix (how revenue distributes across categories). Categories with less than the configured minimum revenue share are excluded from Opportunity Mix.
- When to use it: Quarterly planning. Identify categories to invest in, hold, or wind down.
Visits and conversion in Pulse Insights
Pulse Insights also compares the last 7 full days of visits and conversion with your usual week over the previous four weeks. It can tell you when revenue moved mainly because of visits or mainly because of conversion, when more visits came with lower conversion, when conversion fell while visits held steady, and when visits fell while conversion held steady.
Visit and conversion insights use Pulse visitor tracking or Google Analytics, whichever covers both periods completely. They stay quiet until both periods are fully covered and there are enough visits and orders to compare, and when your stores use different time zones. They only compare weeks, so low-volume stores on the four-week view get none.
Traffic and Timing
- What it does: A half-width tabbed card combining Visitor Trends and Orders By Hour views in a single section, surfacing both traffic patterns and purchase timing without scrolling. Visitor Trends counts real shoppers only: known search crawlers, link previews, uptime monitors and headless browsers are left out, and a new store shows "Collecting visitor history" with a link to tracking diagnostics until first-party visits have been recorded.
- When to use it: Correlate visit spikes with order surges. Find the gap between peak traffic and peak buying to inform UX and promotional timing.
Payment and Shipping Methods
- What it does: A half-width tabbed card (section ID
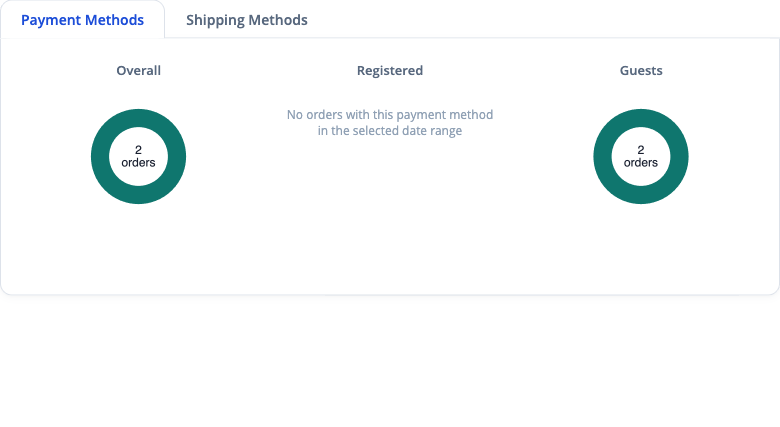
payment_methods) with two tabs. The Payment Methods tab shows three side-by-side donut charts - Overall, Customers, and Guests - each breaking down revenue by payment method. The Shipping Methods tab shows the same three donuts breaking down revenue by shipping carrier. Payment methods with no payment information required, including free orders, display as None. Card payments are labelled by processor, e.g. Credit Card [Stripe]. Orders paid with Apple Pay, Google Pay or Link appear as their own rows when the store records the wallet. Overall, Customers and Guests use the same set of six methods so their rows line up, and a method with orders in the current period but none in the prior period shows New instead of n/a as its trend. The Guests and Overall columns hide automatically when they have zero orders; the Guests Favourite card also hides when there are no guest orders. Shipping Methods hides automatically on stores with no shippable orders. Chart data is fetched from separate endpoints (pulse/payment/dataandpulse/shipping/data) and lazy-renders when the tab is first activated. - When to use it: Understand which payment and shipping methods your customers prefer versus guests. Spot if a payment gateway is underperforming for a customer segment so you can investigate or prioritise checkout optimisation.
Contribution reports (Pro)
- What it does: Product contribution margin and Contribution by brand show net product sales, the item cost Magento recorded on each order, the contribution left over and the margin, per product or per brand. Find them under Pulse > Reports.
- Contribution is not net profit. Shipping, payment fees, advertising, order-level costs, tax, returns handling and overheads are not deducted.
- Item cost comes from the cost Magento saved on each order at checkout, so later catalog cost changes never rewrite past orders. Orders placed before a product had a cost have no recorded cost.
- A missing cost is never treated as zero. That product or brand shows no contribution, the report total is withheld, and the report shows how many sale lines and what share of net sales have a recorded cost, plus a subtotal for the products or brands that are fully costed. Sale lines Pulse cannot read reliably, such as a refund that names only part of a bundle or cancels more than was ordered, are treated the same way.
- Brand uses each product's current brand, so moving a product to another brand changes past periods too.
- Export to CSV for exact four-decimal figures, or to PDF for up to 100 products or brands.
Dashboard layout, presets, and tab choosers
- What it does: The gear icon in the dashboard header opens the layout panel. Pick one of four built-in presets (All, Marketing, Warehouse, Minimal), drag sections into the order you want, hide sections you do not need, and save the result as a named layout. Everything is stored per admin user on the server, so it follows you between browsers.
- Preset order: The All preset now shows the live ticker first, then the revenue chart, then the KPI tiles, with the Visitor tracking strip at the bottom of the page. If you are still on a built-in preset and have not changed anything, Pulse moves you to the new order automatically the next time the dashboard loads. Any layout you have customised, or saved under a name, is left exactly as it is - drag the strip to move it, or re-pick the preset.
- Tab choosers: The tabbed cards (Top Products and Top Customers, Category Share and Momentum, Opportunity Mix and Revenue Mix, Visitor Trends and Orders By Hour, Payment and Shipping Methods) each have a small chooser button in the card header. Untick a tab to hide it from that card. The same tabs also appear under their card in the Sections tree of the layout panel.
- At least one tab stays visible: The last visible tab in a card cannot be unticked, and the chooser says so. Hide the whole card from the Sections tree instead if you do not want it at all.
- When to use it: Give warehouse staff a fulfilment-only view, keep the marketing team focused on campaigns, or trim a card to the single tab you check every morning.
- Notes: Hiding a tab or reordering a section switches the badge in the header to Custom. Choosing a preset again restores that preset's default arrangement, including any hidden tabs.
Campaign analytics dashboard
- What it does: A campaign leaderboard ranked by revenue, with health scoring (working / mixed / not working / needs data), period-over-period growth, top-five winners and losers, a source pie chart, device breakdowns, and new-customer columns on each campaign row. The leaderboard lists paid campaigns only: Search Console, organic, direct and referral traffic stay in the source and search reports instead. Last 24 Months is available once campaign history for that range has been prepared. Until then the report asks you to choose a shorter range. Late refunds, cancellations and order edits are picked up for older months by the hourly refresh. Each Google Ads row shows its attribution basis ("Reviewed mapping" or "Based on tracking settings observed for this period") and, when there are any, how many orders had no known source. Return on ad spend (ROAS) is revenue divided by spend and profit on ad spend (POAS) is profit divided by spend; when there is no spend or revenue to divide by, the figure shows as Not available rather than zero.
- When to use it: Weekly or monthly marketing reviews. Pair with Ad Spend to see cost against revenue.
- Exports: the Campaign ROI and Paid Campaign exports include two new columns. Attribution Basis gives the evidence behind each campaign's figures (Reviewed mapping, or Based on tracking settings observed for this period), and blank means no evidence applies. Orders With No Known Source gives the count of orders in the period that Pulse could not link to any source.
- Config path:
moogento_pulse/campaigns/*
Ad spend and ROI
- What it does: Daily sync of impressions, clicks, and cost from Google Ads. Campaigns are scored as winning, losing, break-even, or spending-with-no-orders. Pulse recommends pausing a campaign or reducing or increasing its budget. Pulse never changes a campaign itself: it only reads from Google Ads, so you apply each change in your Google Ads account.
- Review in Google Ads: each Google Ads campaign row has a "Review in Google Ads" link that opens the campaign in your Google Ads account, or "Open the nearest available Google Ads entity" when the exact campaign page cannot be linked. Nothing is paused or edited until you make the change there.
- Evidence levels: every recommendation states how Pulse linked the campaign's orders to it.
- Reviewed mapping: a reviewed record ties the campaign to its orders for the period.
- Based on tracking settings observed for this period: the campaign's UTM tracking settings stayed the same through the whole period, as seen in the Google Ads URL data. Pulse did not have a reviewed record for it, so this advice is medium confidence and is never marked high.
- Zero-order pause advice: a campaign with spend and clicks but no orders can be shown as a pause recommendation. The wording reads like "No orders placed from [start] to [end] were credited to this campaign under the recorded attribution model; N orders in that period had no known source." Orders with no known source (direct or untracked visits) are counted, not credited to the campaign. A pause is high confidence only when the reviewed evidence is in place, Google reports no goal credits for this campaign while the account as a whole has some, and the clicks would normally be expected to produce several orders at your store's conversion rate. Otherwise it is medium.
- Late orders: an order from a click made near the end of the period can arrive after the period closes. The advice says so. If a matching order arrives after the period, Pulse stops showing the zero-order pause, so check the advice again before you act on a recent period.
- When to use it: Any store that runs paid search. Budget review meetings move from hours to minutes.
- Meta Ads (Pro): the same daily spend, click and impression sync from a read-only Meta Ads connection, shown beside Google Ads in the paid campaign table.
- Config paths:
moogento_pulse/ad_spend/*,moogento_pulse/ad_spend_google/*,moogento_pulse/ad_spend_meta/*
Enable it with Enable: Ad Spend Tracking in Campaigns: Analytics & Ad Spend. Sync frequency, look-back days and ROI thresholds keep their defaults and are changed from the command line.
Search Console integration (Growth or Pro)
- What it does: Syncs organic search performance (queries and landing pages) from Google Search Console so the campaign view, event timeline, and suggestions can lean on real organic data.
- When to use it: Stores with meaningful organic traffic that want attribution evidence beyond UTM tags.
- Config paths:
moogento_pulse/search_console/*,moogento_pulse/search_console_google/*
Enable it with Enable: Search Console Sync in Connect: Google, then connect with the Search Console Connect button.
AI Search Intelligence
- What it does: Groups organic search sources (Google, Bing, DuckDuckGo) and AI referrers (ChatGPT, Claude, Gemini, Perplexity, Copilot) into a single attribution-evidence panel, and layers in Search Console query and landing-page evidence on top of ProfitEasy order attribution. When enabled, a privacy-first storefront beacon records AI-referred visits - no IP addresses, user agents, or prompt text are stored, only the normalized AI source and landing path. The AI Search card shows per-source visit counts, order counts, visits-to-orders conversion, and period-over-period visit deltas, plus top AI-driven landing pages.
- When to use it: Any store curious how much traffic and revenue is coming from AI assistants rather than traditional search, or that wants organic search evidence alongside paid campaign attribution.
- Config path:
moogento_pulse/search_intelligence/ai_referral_tracking
Switch it on with Track: AI Referral Visits in AI: Tracking & Suggestions.
Category intelligence
- What it does: A 2x2 tile grid summarising category momentum, opportunity mix, full-price vs discounted share, and category share, plus a rule-based suggestion feed (restock, price, promotion). Tiles are hoverable, dismissible, and replaceable from an empty-slot chooser.
- When to use it: Merchandising reviews and restock planning. Pair with NotifyMe for demand-driven restock signals.
- Config path:
moogento_pulse/category_intelligence/*
Switch the tiles on with Show: Category Intelligence in Setup: Dashboard. Momentum and opportunity thresholds keep their defaults and are changed from the command line.
Ecosystem widgets
- What it does: Half-width cards that render when the relevant Moogento module is installed and listed under Show: Enabled Widgets. Providers include ProfitEasy (profit, AOV, CLV), HelloCustomer (converted sales count and revenue for the active date range), NotifyMe (waitlist demand paired with NotifyMe-attributed revenue), SmartCart, SmartListings, TrackEasy (shipment risk), and PickPack / PicknScan (fulfilment queue).
- When to use it: The more Moogento modules you run, the richer the dashboard gets - leave all installed providers enabled unless you're actively auditing performance.