

Magento Dashboard Design: What to Check Every Morning

A Magento store dashboard should answer one question in under two minutes: is anything wrong, and what do I do about it? That means a few action metrics - yesterday's profit (not just revenue), orders waiting to ship, low-stock lines, refund rate, anything abnormal - not a wall of lifetime totals and pageviews. Lead with the numbers that change a decision today; hide the ones that only make you feel good.
Why most ecommerce dashboards are the wrong dashboard
Open the default admin dashboard in almost any ecommerce platform and you'll see the same thing: lifetime sales, a revenue chart, bestsellers by quantity, maybe some session data. It's a report, not a control panel. Nothing on it tells you what needs doing this morning, and half of it never changes fast enough to matter.
Magento 2's default dashboard is a clear example. It shows lifetime sales, average order value, last orders, bestsellers and a revenue tab - all backward-looking, none of it flagging a problem, and its chart is often turned off for performance on larger stores, so plenty of merchants never see it at all. The pattern repeats across the wider tool landscape: many analytics products lead with sessions, pageviews and total revenue because those numbers are big and always go up and to the right, which is exactly why they're the least useful thing to look at first.
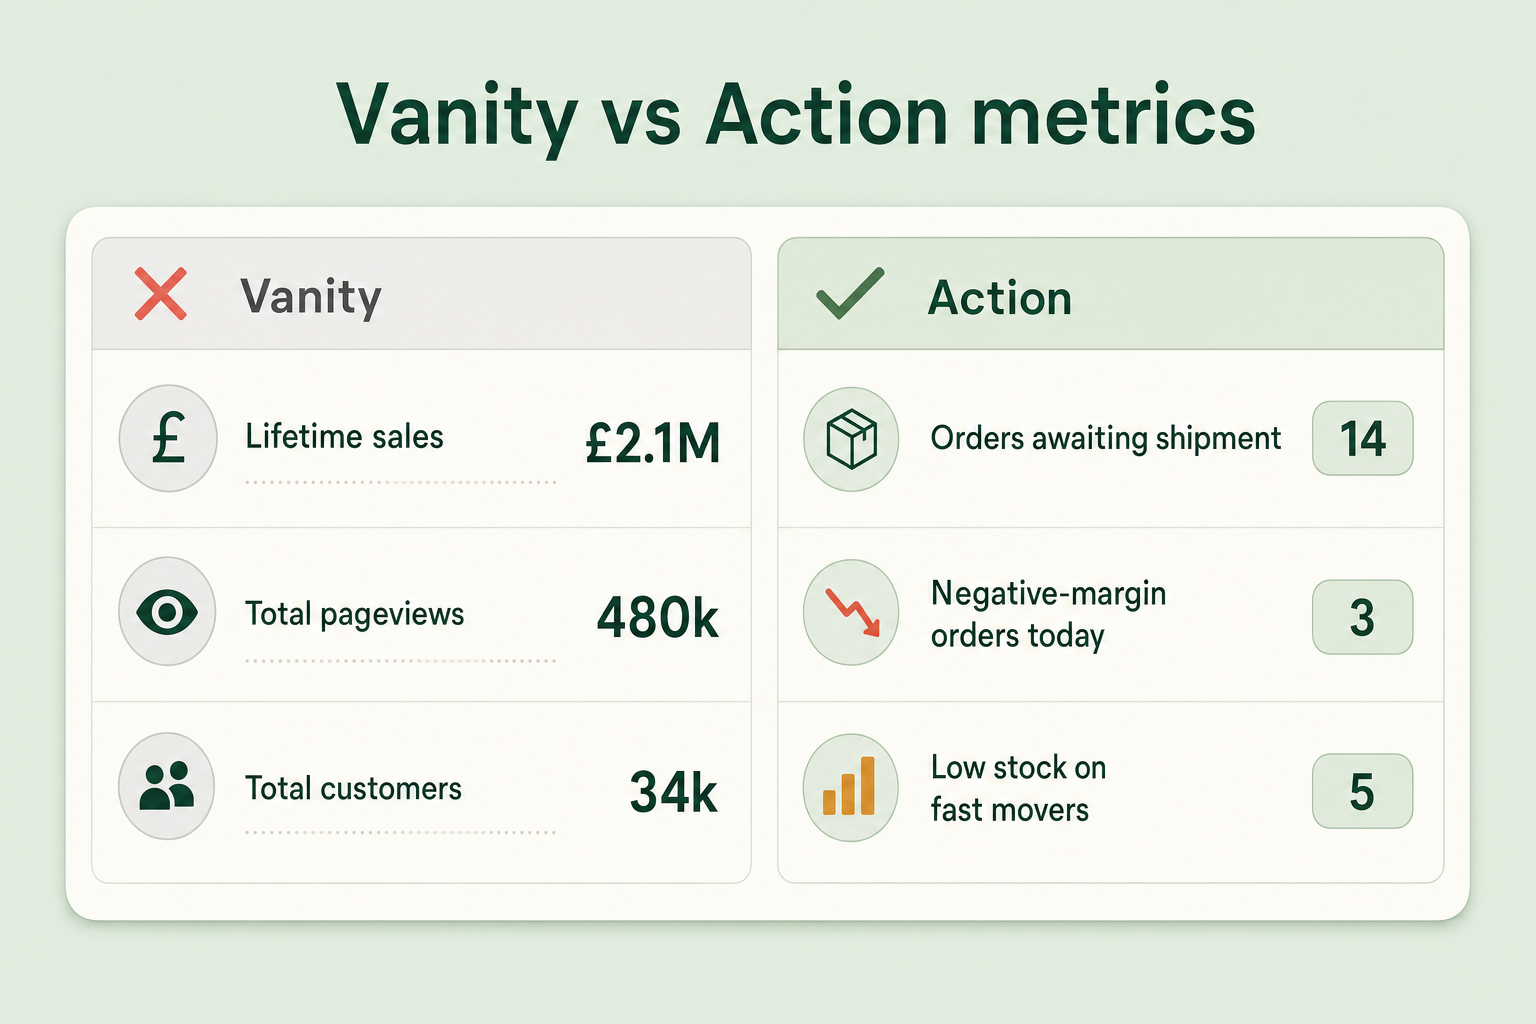
What's the difference between vanity metrics and action metrics?
A vanity metric makes you feel informed but doesn't change what you do. An action metric points at a specific decision. The test is simple: if the number moved, would you do something today? If not, it doesn't belong on the morning view.
| Vanity metric | Why it's weak | Action metric instead |
|---|---|---|
| Lifetime sales | Never goes down, prompts nothing | Yesterday's profit vs the trailing average |
| Total pageviews | Traffic without outcome | Conversion rate, and orders vs yesterday |
| Total revenue | Hides margin | Profit, and any negative-margin orders |
| Bestsellers by units | Ignores margin and stock | Products low on stock that sell fast |
| Total customers | Vanity count | New vs returning split, repeat rate |
| Orders (all time) | Historical | Orders awaiting shipment right now |
None of the left column is wrong to know. It just doesn't belong on the screen you look at first thing, because none of it tells you where to spend the next hour.
What belongs on a store owner's morning dashboard?
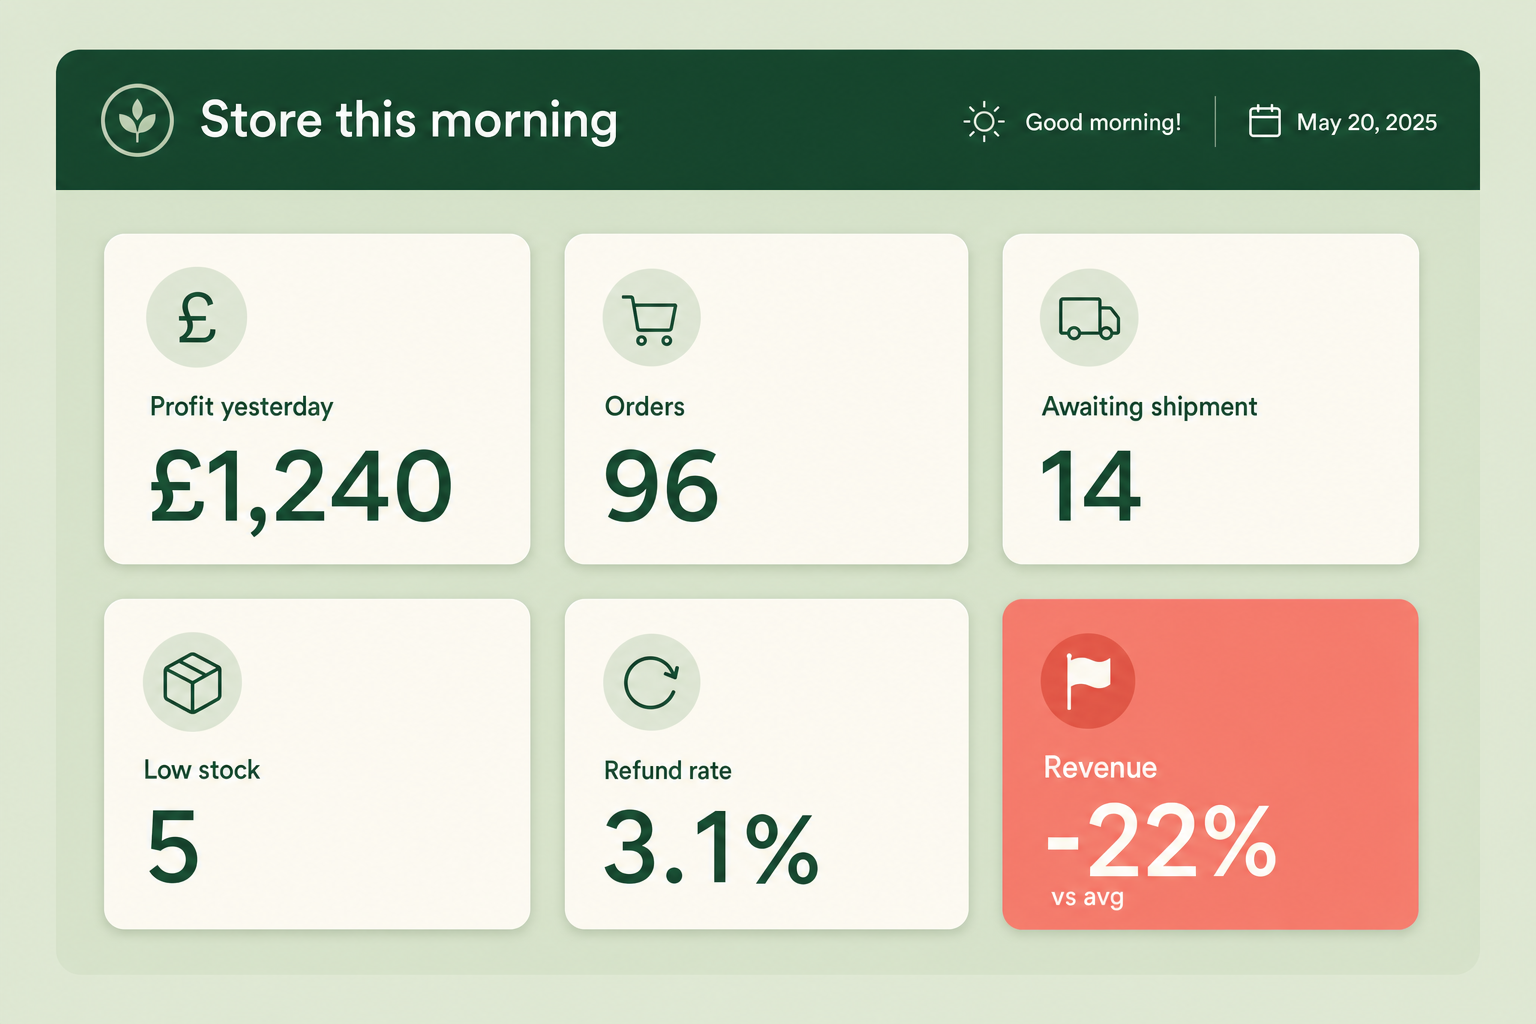
For the person who owns the outcome, six widgets cover the morning check. Each one is here because a bad reading triggers an action.
- Yesterday's profit vs trailing average. Profit, not revenue, and compared to a baseline so a drop is obvious. This is the single most important tile.
- Orders vs yesterday and vs same day last week. Volume with context. A quiet Tuesday is fine; a quiet Tuesday that's half of last Tuesday is a signal.
- Orders awaiting shipment. The operational backlog. If it's climbing, fulfilment needs attention before customers start asking.
- Low-stock and out-of-stock on fast movers. Lost sales you can still prevent. A bestseller at zero stock is money walking out.
- Refund and return rate. A spike here is an early warning of a product or fulfilment problem.
- Anything abnormal. A single flag that says "revenue is down sharply" or "refunds spiked" so you don't have to spot it yourself in the numbers.
Different roles need different dashboards
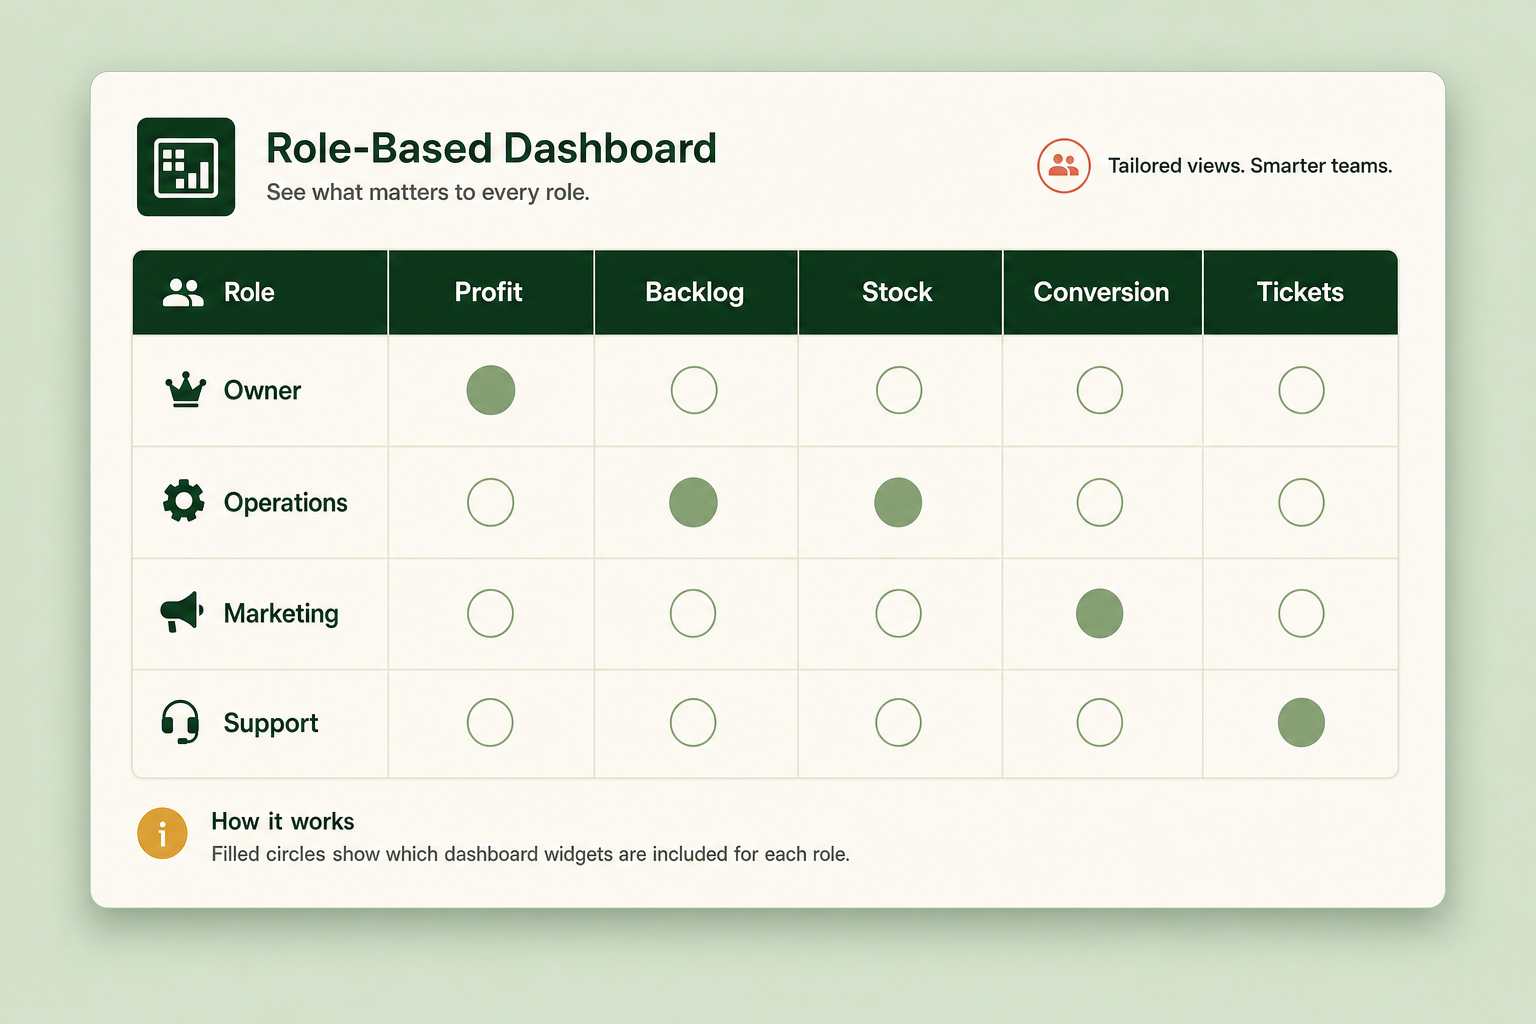
One dashboard for everyone means everyone reads past most of it. The widgets that matter depend on the job. A practical split for a store team:
| Role | Leads with | Also watches |
|---|---|---|
| Owner | Profit, orders vs baseline, abnormal-metric flags | Repeat rate, cash from top products |
| Operations manager | Orders awaiting shipment, fulfilment backlog age | Low stock, carrier delays, refund reasons |
| Marketing manager | Conversion rate, new vs returning, campaign profit | Traffic sources, discount usage, AOV |
| Support manager | Ticket volume vs baseline, refund rate | Delivery exceptions, repeat-contact orders |
A sample daily review workflow
The dashboard is only useful if it drives a routine. A workable morning pass, five minutes:
- Glance at the flags. Anything abnormal overnight? A revenue drop, a refund spike, stock at zero on a hero product? Deal with a red flag before anything else.
- Check profit against the baseline. Not just "did we sell", but "did yesterday make money relative to normal". A revenue-up, profit-down day is worth understanding.
- Clear the operational backlog. Orders awaiting shipment, oldest first. If the queue is growing day over day, that's the week's priority.
- Scan stock on fast movers. Reorder or flag anything about to sell out that you can't afford to lose.
- Note anything to investigate later. A soft conversion dip or a rising return rate on one product isn't a fire, but it's a note for the weekly review.
How this applies to Magento 2
Magento 2's admin gives you the raw material and none of the arrangement. The default dashboard is backward-looking and often switched off; the Reports menu has genuinely useful data but it's spread across a dozen separate reports you'd have to open one by one every morning, which nobody does. There's no profit figure anywhere, no single "is anything wrong" view, and no way to see the shipment backlog, low stock and refund rate on one screen. As of Magento 2.4.9, assembling a real morning dashboard means either building custom admin widgets or adding an extension that does it.
Where Moogento helps
Pulse is a live admin dashboard built around action metrics rather than the default's lifetime totals - KPIs with trend context, top products and customers, new-versus-returning, category and search intelligence, and campaign analytics. It also runs a set of background detectors every half hour for things like a sharp revenue drop, a refund spike, an order slowdown or stock risk, and surfaces them in an in-admin alert centre - so the "anything abnormal" tile is doing the watching for you when you log in. Worth being precise: Pulse shows those flags inside the admin, it doesn't email or text you, so it's a dashboard you check rather than a pager.
The profit tile that should sit where revenue usually does comes from ProfitEasy, which calculates real per-order profit and feeds it into Pulse's campaign and KPI views. And the low-stock-on-fast-movers widget is StockEasy territory, tracking stock against sales velocity so the number on your morning dashboard is "about to lose sales", not just "quantity remaining".
Dashboard audit checklist
- Open your current dashboard. Time how long until it tells you to do something. If it doesn't, it's a report.
- Count the metrics on it that would change your day if they moved. Cut the rest from the morning view.
- Is profit on there, or just revenue? If just revenue, you're missing margin problems.
- Can you see orders awaiting shipment without leaving the dashboard?
- Would a sharp overnight drop in revenue be flagged, or would you have to notice it yourself?
- Does everyone use the same dashboard? Map widgets to roles instead.
- Write down your actual morning routine. Does your dashboard support it, or fight it?
FAQ
Why is the Magento dashboard disabled by default?
On many installs the admin dashboard's charts and aggregations are switched off (Stores > Configuration > Advanced > Admin > Dashboard) because running them on every admin login adds database load on large catalogues. It's a performance default, not a bug - but it means the built-in dashboard often shows nothing until someone re-enables it, which is one reason so few merchants rely on it.
What metrics should an ecommerce owner check daily?
Yesterday's profit against a baseline, order count with week-on-week context, orders awaiting shipment, low stock on fast-moving products, refund rate, and any abnormal-metric flags. Everything else - lifetime totals, full traffic breakdowns, detailed product reports - belongs in a weekly or monthly review, not the daily glance.
What's the difference between a KPI and a vanity metric?
A KPI is tied to a goal and prompts a decision when it moves; a vanity metric only ever goes up and doesn't change what you do. Lifetime sales is a vanity metric. Yesterday's profit versus your trailing average is a KPI, because a dip tells you to go and find out why.
Can I customise the Magento admin dashboard?
The default dashboard isn't configurable in any meaningful way - you can't rearrange widgets or add profit, backlog or stock tiles to it. Building a genuinely useful morning view means custom admin development or an extension that provides a purpose-built dashboard with the action metrics the default lacks.
Start by cutting, not adding. Take whatever you look at now and remove every number that wouldn't change your morning if it moved. What's left is the beginning of a real dashboard.


