Difference between revisions of "Optimising Tools for Magento"
m |
m |
||
| Line 4: | Line 4: | ||
But, there are some simple things you can do to speed up your Magento install, but first we need to quantify the speed and work out what we are testing. | But, there are some simple things you can do to speed up your Magento install, but first we need to quantify the speed and work out what we are testing. | ||
| − | + | <div style="clear:both;"> </div> | |
==External Monitoring Tools== | ==External Monitoring Tools== | ||
===GTMetrix=== | ===GTMetrix=== | ||
Revision as of 12:04, 21 April 2014
Contents
Magento is famously resource-hungry. For instance, a shared server is not going to cut it.
But, there are some simple things you can do to speed up your Magento install, but first we need to quantify the speed and work out what we are testing.
External Monitoring Tools
GTMetrix
Straight away, I'd go to gtmetrix.com and register an account. On the free account you can track 4 or 5 pages. For starters, add in your homepage, a product page, and a catalog page. You do this in 'Page settings' once you've checked a page, just set it to check daily. You'll now have a nice history being auto-generated of your optimization efforts over time.
GTMetrix shows the same waterfall as Firebug shows in the net panel, with the benefit that you can specify which location it's testing from - if your customers are mainly in Australia then you sitting and testing from London won't be so useful. It also shows the YSlow (sell below) results over time which is really useful.
Firebug
This for me is the easiest way to see how your site is loading - the various parts, the speed they are loading, and any bottlenecks.
This is a plugin for Firefox, which you can get here, or in the Firefox (Tools > Add-ons) section.
Once installed, and turned on, open the 'Net' panel and refresh your page.

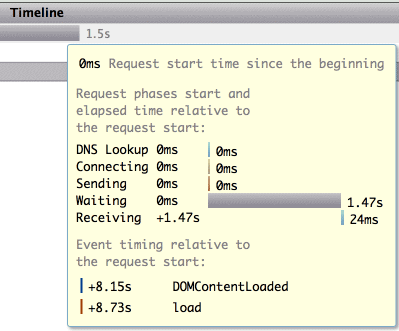
Firebug timings
If you hover over each section on the timeline you'll see a breakdown of how that part loaded.

YSlow
Another very useful way to quickly find bottlenecks in your site load time, is YSlow. This will give your website a quick A-D grade based on what you should be doing at a basic level to ensure a fast website. GTMetrix handily includes the results from this as well.
What to measure
Something which often confuses people is what to measure. There are 3 different states in your browser which can be tested:
- Totally fresh refresh : Hold the ⇧ Shift key and click the Reload button on the address bar.
- This is reloading all elements.
- Half-refresh : Hold the ⌘ Cmd key and press R
- This will talk to the servers of each element and check if they have changed, and download changes.
- No-refresh : Click in the address bar and click ↵ Enter
- This won't check any elements unless the cache headers tell it to.
I would say the first one is the most important to test actual site build against, but you can see that having the correct cache headers (and the ability of your server to send back 'Not-modified' headers) will significantly impact navigating around the site.
Magento-side Optimising
Cron Monitoring
Magento has a lot of internal cron jobs (which all run via the single parent Magento cron job), which get added to by 3rd party extensions. If there is an issue with one of those individual con jobs it can cause issues for all the other jobs.
It's also not obvious if one of those jobs is taking too long - if it is, it can cause the next job to skip.
The easiest way to see what is going on is to install the great free extension AOE Cron Scheduler. This will show you a nice timeline of all your cron jobs set to run in Magento, and the historical result. You can also disable individual cron jobs which is a quick temporary way out of a runaway job breaking the rest of them.
If you're all set here, now head to the Speed-up Magento Tips section.